Market Update | Fourth Quarter 2024
January 23, 2025
Key Highlights to Keep You Informed
The economy remains surprisingly robust as Q3 Gross Domestic Product (GDP) came in at 3.1% compared to estimates for an increase of 2.8%.
Employment has remained strong as the U.S. added almost half a million jobs in the fourth quarter, including an astounding 256,000 in December, exceeding economists’ estimates by over 100,000. Unemployment fell to 4.1% indicating a healthy but not overheated job market.
The U.S. stock market, measured by the Russell 3000 Index, gained 2.63% in the fourth quarter despite some volatility.
Stocks finished 2024 with their best two-year performance since 1997 & 1998. This time, the two-year period follows a 20% decline in 2022, while the late 1990s were marked by a tech rally and five consecutive annual double-digit returns. Rising interest rates pressured bonds in Q4, with the Bloomberg U.S. Aggregate Index falling 3.1%, but still ended the year with a 1.3% gain.
Inflation remained higher than expected, with November's Consumer Price Index (CPI) up 0.3% from October and 2.7% year-over-year, above the Fed's 2.0% target.
The Fed's preferred Personal Consumption Expenditures (PCE) index rose 0.1% in November, or 2.4% from the previous year. December numbers showed some improvement as core CPI cooled to 3.2% despite an upside surprise in the headline number due to gas prices.
Due to strong economic data and high inflation, expectations for Fed rate cuts have shifted since Q3.
After a 50-basis point cut in September, the Fed made two 25 basis point cuts in Q4, less than anticipated. The median year-end 2025 Fed Funds rate rose to 3.9% from 3.4%, with the Fed signaling a more cautious approach.
Republicans swept the November election, gaining control of the Presidency, House, and Senate.
Stocks rose on expectations of lower taxes and reduced regulations, boosting corporate profit optimism. Bond markets sold off, driving interest rates higher, amid concerns over larger deficits, tariffs, and reduced immigration pushing inflation and rates up. Fed Chair Jerome Powell stated the Fed would not prejudge any policies until they were clearly outlined and enacted.
Quarterly Market Summary
Returns (USD), as of December 31, 2024
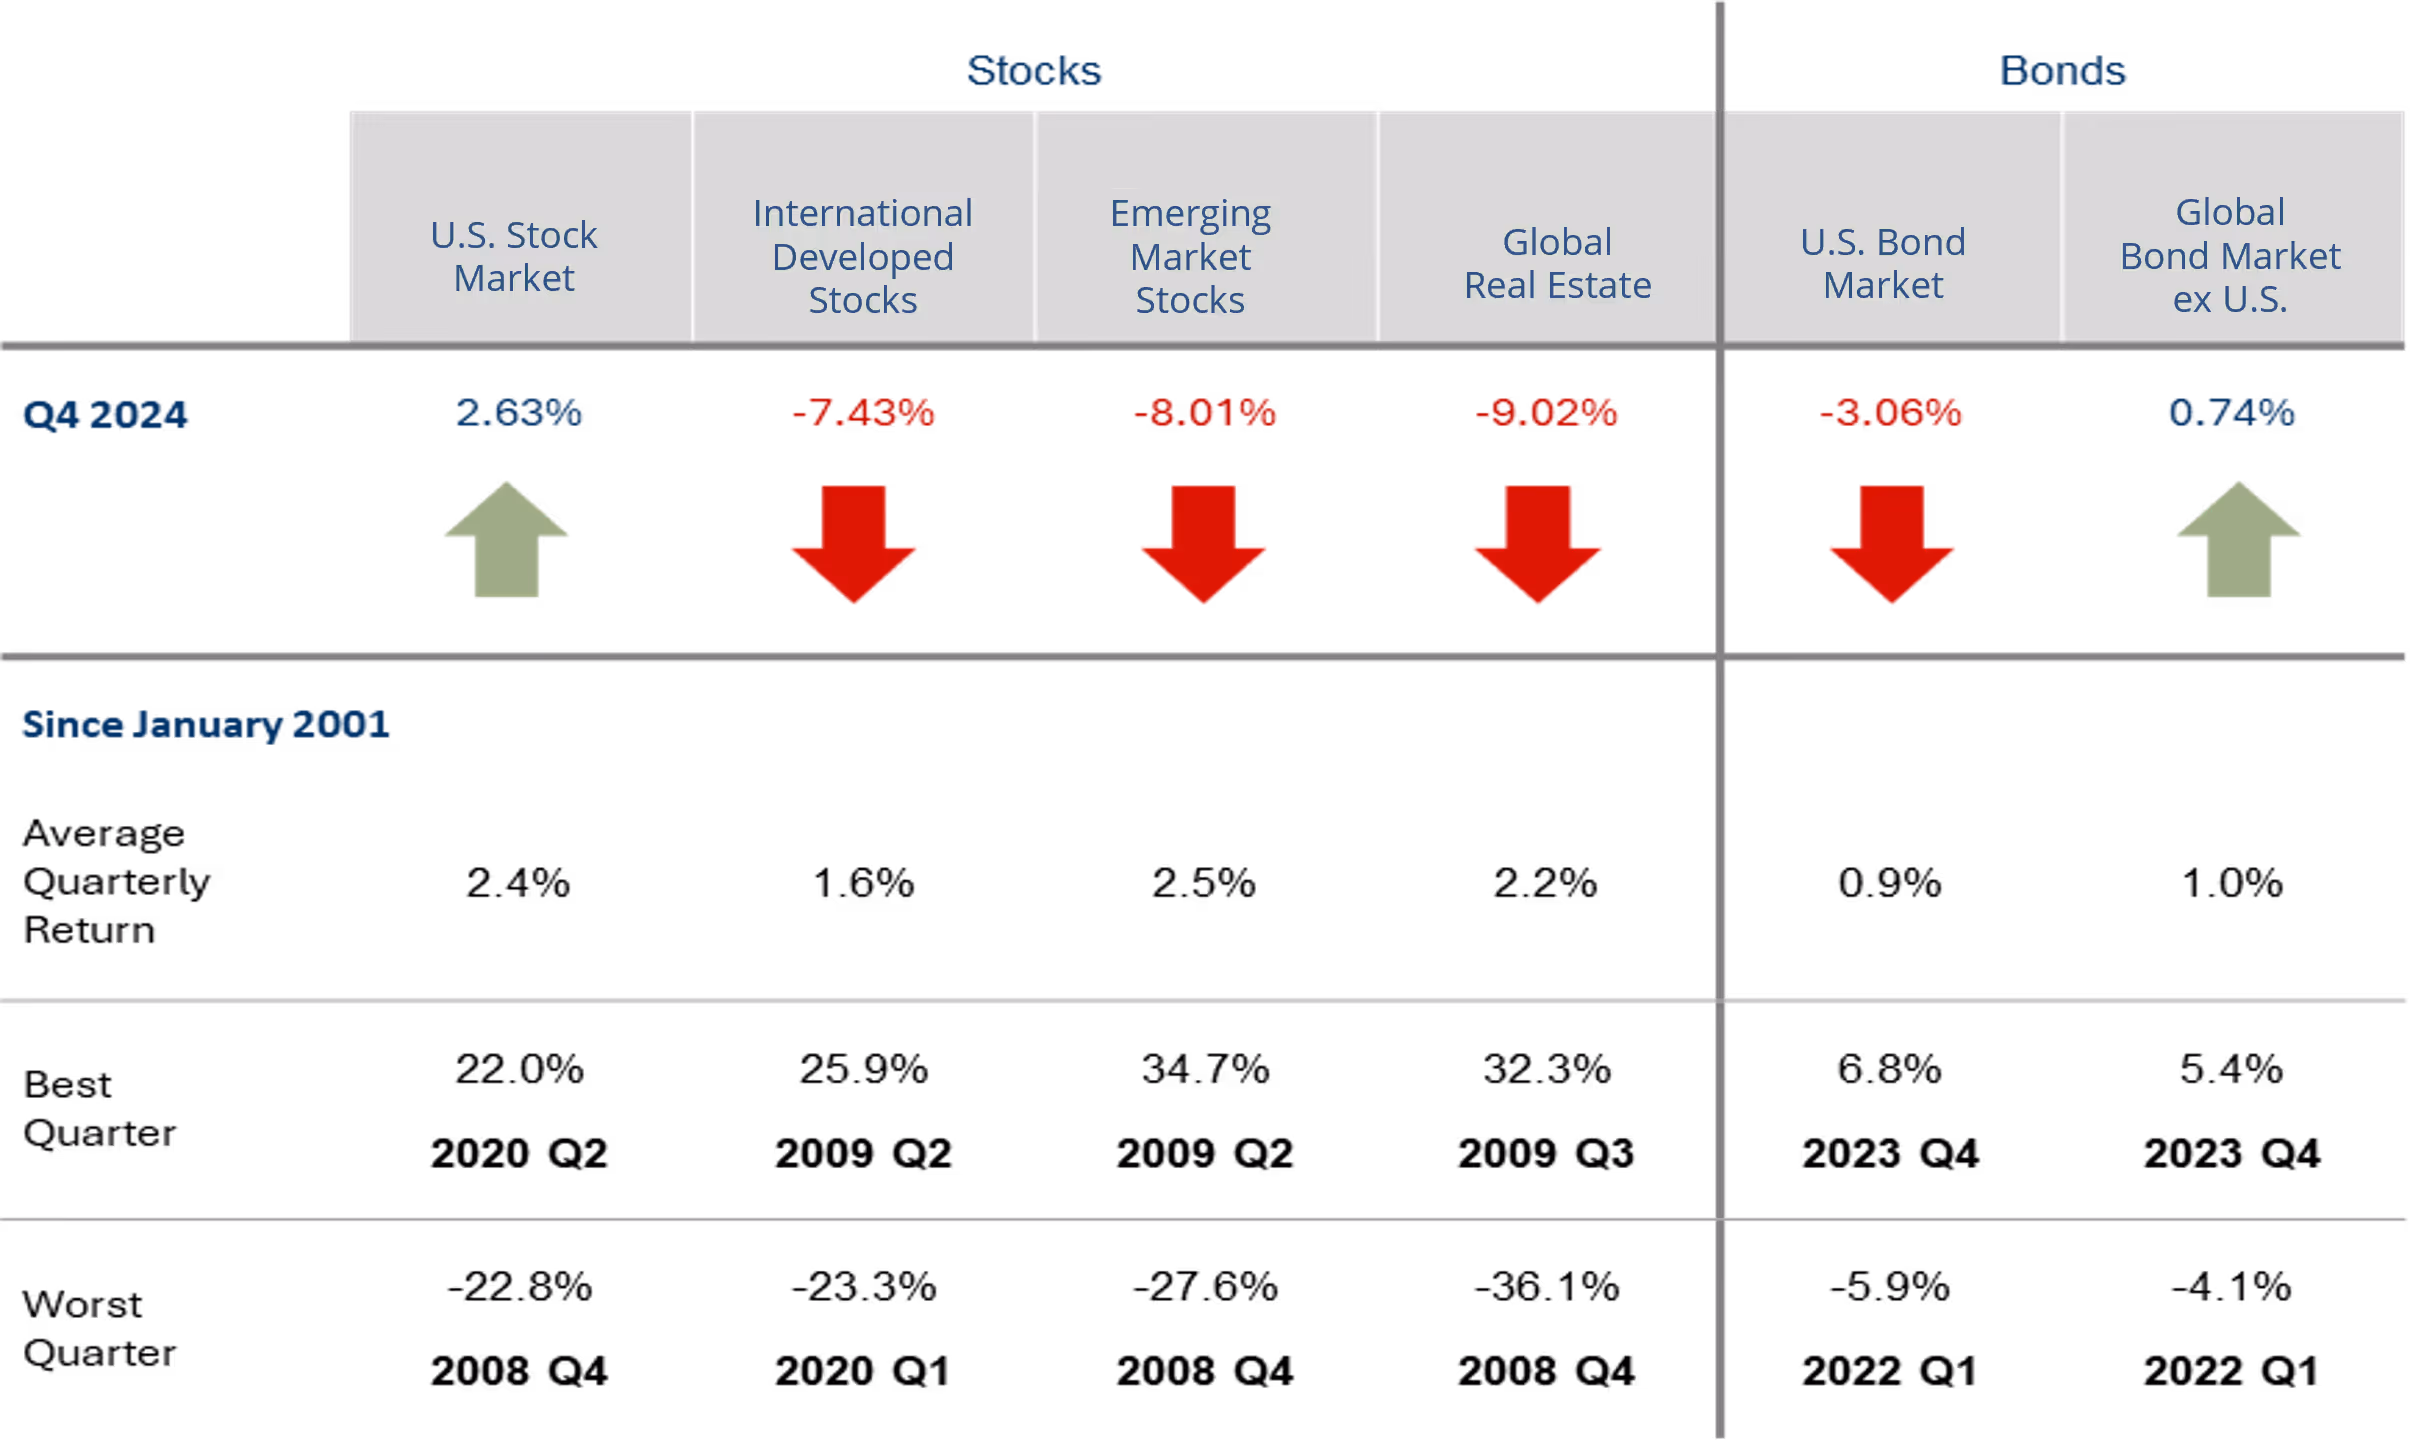
Past performance is not a guarantee of future results. Indices are not available for direct investment. Index performance does not reflect the expenses associated with the management of an actual portfolio. Market segment (index representation) as follows: US Stock Market (Russell 3000 Index), International Developed Stocks (MSCI World ex USA Index [net dividends]), Emerging Markets (MSCI Emerging Markets Index [net dividends]), Global Real Estate (S&P Global REIT Index [net dividends]), US Bond Market (Bloomberg US Aggregate Bond Index), and Global BondMarket ex US (Bloomberg Global Aggregate ex-USD Bond Index [hedged to USD]). S&P data © 2025 S&P Dow Jones Indices LLC, a division of S&P Global. All rights reserved. Frank Russell Company is the source and owner of the trademarks, service marks, and copyrights related to the Russell Indexes. MSCI data © MSCI 2025, all rights reserved. Bloomberg data provided by Bloomberg.
Notable Events in Q4
October
Strong economic data along with higher inflation readings put pressure on bonds and stocks early in the month as investors dialed back expectations for rate cuts from the Fed. The Middle East Conflict also unnerved markets as the Israel Defense Forces expanded operations into southern Lebanon. Increased tensions led to Iran launching ballistic missiles at Israel. Although bonds as measured by the Bloomberg Global Aggregate continued to fall as yields rose throughout the month, stocks posted a modest recovery mid-month as earnings reports were mostly positive. Technology stocks posted good results, but in most cases were not good enough to support stock prices that have been priced for perfection. This put more pressure on stock prices late in the month and led to negative returns for the month.
November
The election brought some sense of direction as U.S. Republicans re-gained control of the House of Representatives and now control all three parts of the U.S. federal government. This clarity may have contributed to a 5.4% return for the S&P 500 in the month, and overall positive returns for world markets. November also brought volatility to both the world and the financial markets. The first half of the month experienced ups and downs as Germany's coalition government collapsed after Chancellor Scholz fired Finance Minister Christian Lindner and over 10,000 North Korea troops joined Russian forces to fight Ukraine, though Ukraine countered by beginning to use American-made longer-range missiles.
December
The Federal Reserve cut rates by 25 basis points, reflecting confidence with inflation progress and acknowledging a cooling labor market. However, Chair Jerome Powell emphasized a slower pace of cuts in 2025 due to persistently high inflation expectations (i.e. inflation going forward). While inflation indicators, like shelter prices, are improving, trade policy uncertainties under the incoming Trump administration and rising Treasury yields driven by fiscal and economic strength pose risks. Despite this, fixed income markets offer opportunities for preservation of capital amid economic uncertainties.
Economic Indicators
Economic indicators continue to show a growing economy that gives the Fed room to slow rate cuts. To illustrate, the employment market remains resilient and stronger than expected1. Supporting this, in both the Purchasing Managers' Manufacturing Index (PMI)2 and the Institute for Supply Management (ISM)3 reports, the service sector remains on solid footing as hiring picked up following the election. Manufacturing improved from last quarter but remains in contraction as demand is soft4. However, Consumer Confidence5 shows that there is pessimism about the future, and Consumer Sentiment6 hasn’t changed much.
Overall, the economy still looks healthy, but there has been widespread concern about potential tariffs that has created a sense of negativity. In addition, it seems inflation worries are picking up as a result. The general health of the economy and low employment makes significant rate cuts less likely, while the risk of rising inflation reduces the likelihood even further. The effects of potential tariffs will be important to monitor in 2025, as higher inflation could cause a need for rate hikes and disruption in the market.
Market Impact on Major Asset Classes
Impact on Equities
The Fed signaled fewer rate cuts for 2025 during the December meeting, but the S&P 500 was still able to provide a 2.4% return in the fourth quarter. Furthermore, the continued run of the Magnificent 7 (returning over 60%) led to the second straight year of 20%+ returns, with the S&P 500 ending up 25.0%. In fact, for the past 15 years the annualized return for the index has been over 16%, compared to a long run average of about 10% per year since the 1950s. Interestingly, going back 15 years, the starting cyclically adjusted price to earnings ratio (CAPE) was 13x, and U.S. stocks were cheaper than international stocks, indicating that future returns should be strong. As it turns out, they were. U.S. small caps, measured by the Russell 2000, also performed well for the year (up 11.5%), but lagged large caps, nonetheless.
Outside of the U.S., stock returns were lower, but positive. Developed international markets, measured by MSCI EAFE, were up 4.4% for the year, as issues like Germany’s weak economy, poor export demand, rising energy costs, and a strong dollar weighed on returns.
MSCI Japan provided respectable returns, up 8.7% for the year as Japanese stocks have strong fundamentals and economic policies are normalizing.
Despite a year-end pullback, MSCI Emerging Markets also provided returns above 8% for a relatively average year. Though they continue to struggle with a weak economy, fears of potential U.S. tariffs, and a strong dollar like the rest of the world, MSCI China was a key contributor to the region with a 19.7% return in 2024.
Looking ahead, there are both risks and opportunities for global markets. Encouragingly, S&P 500 corporate EPS are forecasted to grow at 14.8% in 2025 which should provide a tailwind for U.S. stocks. While fundamentals are less promising, non-U.S. stocks are trading at a 40% discount to the U.S., which is the largest discount on record.
There are also risks. As we have mentioned before, valuations are not useful from a timing perspective, but the cyclically adjusted price to earnings ratio (CAPE) for U.S. stocks is approaching 40X, implying that returns for expensive stocks may be subdued over the intermediate term. In fact, the only time stocks were more expensive was during the dot-com bubble. While that should cause some concern, it is also true that companies today are more profitable, and the world is different than what it was in the early 2000s.
On balance, the global markets are comprised of historically expensive U.S. stocks (especially large growth), but with currently healthy fundamentals. Conversely, international stocks have weaker fundamentals, with pockets of strength, but historically inexpensive valuations. Given the risks and opportunities seem to balance in an uncertain world, diversification continues to provide a prudent path forward. As history has shown, both higher valuations eventually lead to lower returns, and lower valuations eventually lead to higher returns. It is also good to remember that some of the most dangerous words in investing are, “this time is different.”
Major World Equity Market Performance for Q4 2024

Source:
YCharts Total Returns as of 12/31/2024
Nasdaq, 2024 Review and 2025 Outlook, https://www.nasdaq.com/articles/2024-review-and-2025-outlook
Impact on Fixed Income
The bond market saw mixed performance in the fourth quarter, as concerns about growing U.S. federal deficits and fewer anticipated Fed rate cuts in 2025 put pressure on bonds. The leading bond benchmark, the Bloomberg U.S. Aggregate Bond Index, posted a moderately negative return for the quarter but managed a modest gain for the full year.
In recent weeks, both the Treasury and Municipal yield curves have returned to a more typical upward slope for the first time in several years. Since September, the Federal Reserve has reduced the Fed Funds rate by 100 basis points in response to moderating inflation. However, 10-year Treasury yields (a key benchmark for the financial markets and the broader economy) have surged by nearly 100 basis points, driven by robust economic growth, persistent inflation pressures, and concerns about a potentially widening budget deficit and higher inflation under the Trump administration. The upward sloping yield curves should encourage bond buyers to move out of cash and into longer-term debt as they will be more appropriately compensated for adding risk.
Diving into the details, shorter-duration bonds outperformed their longer-duration counterparts in both Q4 and throughout 2024, supported by ongoing Fed rate cuts. In contrast, longer-term bonds experienced declines, as concerns about fiscal policy, a strong economy, and the inflation outlook weighed on the long end of the yield curve. In both the corporate and municipal bond markets, high-yield bonds outperformed investment-grade bonds reflecting a preference for risk-taking in the face of steady economic conditions.
On the municipal front, nine states reduced their individual income tax rates on January 1, 2025: Indiana, Iowa, Louisiana, Mississippi, Missouri, Nebraska, New Mexico, North Carolina, and West Virginia. We generally view this as a credit negative as these states are reducing a regularly occurring source of revenue that is widely used to secure general obligation bonds. Internationally, both developed and emerging market bonds posted strong gains for the year emphasizing the importance of having a diversified portfolio and looking for opportunities beyond the U.S.
Major Fixed Income Index Returns for Q4 2024

Source:
YCharts Total Returns as of 12/31/2024
YCharts; Bloomberg U.S. Aggregate Total Return Index.
Tax Foundation. (2024, December 19). State tax changes taking effect January 1, 2025. https://taxfoundation.org/research/all/state/2025-state-tax-changes
Impact on Alternatives
As the Fed cuts interest rates, investors have questions about the benefits of private credit in a lower interest rate environment. Private direct lending is overwhelmingly issued as floating rate debt based on the Secured Overnight Financing Rate (SOFR), which is heavily influenced by the Fed funds rate. As the Fed cuts rates, distribution yields on private credit will fall as rates on the loans adjust, however the “spread” or premium that private credit delivers over SOFR remains consistent. The Cliffwater Direct Lending Index spread over SOFR has remained consistently in the 6.0% range, still providing attractive returns relative to other available fixed income options. By contrast, public credit markets are not only impacted by lower interest rates, but the spread over treasury bond interest rates has been falling. According to JPMorgan, the spread, or premium, over treasury bond rates for high yield bonds is currently 3.4%, below the historical average of 5.8%.
In this environment, the risk adjusted return has remained the same for private credit and fallen for public high yield, making private credit even more attractive. This can partially be explained by the shrinking size of the high yield market as private markets have taken share from public markets over the past several years. Most of the growth in private credit has come at the expense of banks, however there are cases of smaller borrowers opting to raise capital in private markets rather than issuing non-investment grade bonds. Cliffwater forecasts private credit to yield 9.3% in 2025, down from 10.5% in 2024. This compares favorably to the SPDR high yield bond ETF of yield of 7.74% for a similar amount of credit risk and lower equity correlation than high yield.
Performance of Alternative Assets

Sources:
Cambridge Associates as of 12/31/2024
TIAA-CREF Center for Farmland Research, Standard & Poor’s, Federal Reserve, MSCI,
Commodity Research Bureau, Consumer Price Index, NCREIF Farmland (Inception date 4Q 1990)
Looking ahead
Stock and bond markets had large swings through the fourth quarter. Early reaction to the election provided optimism to equity markets that lower taxes and regulation would be a boon to corporate profits, driving stocks higher. Bond investors, concerned over potential increases to deficits and inflation, pushed yields higher and eventually tempered stock market expectations. Political beliefs can generate emotional reactions leading to investment decisions that harm long-term returns. History shows that total time in the market is the driver to better returns, not the President’s political party. An investment of $1,000 in 1953 would have an ending value of $31,000 if invested only during Republican presidencies, $60,000 if invested only during Democratic presidencies or almost $1.9 million if held the entire 70 years7. It is helpful to keep in mind that, despite differences in beliefs, both parties share the intent of supporting a strong economy and will adjust policies to achieve this goal.
It is also important to remember that TMG portfolios are diversified across asset classes and regions, designed to reduce volatility, and optimize returns over the long term. When appropriate for clients with longer time horizons, alternative investments offer greater diversification and the chance to enhance returns. For clients that prefer a more tactical approach, we offer more active management that seeks to take advantage of shorter-term trends within a diversified strategic asset allocation. Most importantly, TMG has and will continue to deploy its sophisticated technology and trading systems to add value during periods of market volatility by conducting tax-loss harvesting, strategic rebalancing, and accelerating Roth conversions, when appropriate. We appreciate your trust and confidence in managing your investments. Our team remains committed to monitoring the markets and making informed decisions to ensure your portfolios are well-positioned for future opportunities.
1 2025 U.S. Economic Events & Analysis – Employment Situation, Econoday, 1/10/2025.
2 2025 U.S. Economic Events & Analysis – PMI Composite Final, Econoday, 1/6/2025.
3 2025 U.S. Economic Events & Analysis – ISM Services Index, Econoday, 1/7/2025.
4 2025 U.S. Economic Events & Analysis – PMI Manufacturing Final, Econoday, 1/2/2025; 2025 U.S. Economic Events & Analysis – ISM Manufacturing Index, Econoday, 1/3/2025.
5 2024 U.S. Economic Events & Analysis – Consumer Confidence, Econoday, 12/23/2024.
6 2025 U.S. Economic Events & Analysis – Consumer Sentiment, Econoday, 1/10/2025.
7 BlackRock Student of the Market 8/31/2024, holding period 1/1/1953 – 8/31/2024.
Need more help?
Contact The Mather Group, your advisor, health insurance professional, or your state’s health insurance assistance program (SHIP) for additional information. SHIP is a national program that offers one-on-one Medicare counseling and assistance to individuals and their families.


Key Highlights to Keep You Informed
The economy remains surprisingly robust as Q3 Gross Domestic Product (GDP) came in at 3.1% compared to estimates for an increase of 2.8%.
Employment has remained strong as the U.S. added almost half a million jobs in the fourth quarter, including an astounding 256,000 in December, exceeding economists’ estimates by over 100,000. Unemployment fell to 4.1% indicating a healthy but not overheated job market.
The U.S. stock market, measured by the Russell 3000 Index, gained 2.63% in the fourth quarter despite some volatility.
Stocks finished 2024 with their best two-year performance since 1997 & 1998. This time, the two-year period follows a 20% decline in 2022, while the late 1990s were marked by a tech rally and five consecutive annual double-digit returns. Rising interest rates pressured bonds in Q4, with the Bloomberg U.S. Aggregate Index falling 3.1%, but still ended the year with a 1.3% gain.
Inflation remained higher than expected, with November's Consumer Price Index (CPI) up 0.3% from October and 2.7% year-over-year, above the Fed's 2.0% target.
The Fed's preferred Personal Consumption Expenditures (PCE) index rose 0.1% in November, or 2.4% from the previous year. December numbers showed some improvement as core CPI cooled to 3.2% despite an upside surprise in the headline number due to gas prices.
Due to strong economic data and high inflation, expectations for Fed rate cuts have shifted since Q3.
After a 50-basis point cut in September, the Fed made two 25 basis point cuts in Q4, less than anticipated. The median year-end 2025 Fed Funds rate rose to 3.9% from 3.4%, with the Fed signaling a more cautious approach.
Republicans swept the November election, gaining control of the Presidency, House, and Senate.
Stocks rose on expectations of lower taxes and reduced regulations, boosting corporate profit optimism. Bond markets sold off, driving interest rates higher, amid concerns over larger deficits, tariffs, and reduced immigration pushing inflation and rates up. Fed Chair Jerome Powell stated the Fed would not prejudge any policies until they were clearly outlined and enacted.
Quarterly Market Summary
Returns (USD), as of December 31, 2024
Past performance is not a guarantee of future results. Indices are not available for direct investment. Index performance does not reflect the expenses associated with the management of an actual portfolio. Market segment (index representation) as follows: US Stock Market (Russell 3000 Index), International Developed Stocks (MSCI World ex USA Index [net dividends]), Emerging Markets (MSCI Emerging Markets Index [net dividends]), Global Real Estate (S&P Global REIT Index [net dividends]), US Bond Market (Bloomberg US Aggregate Bond Index), and Global BondMarket ex US (Bloomberg Global Aggregate ex-USD Bond Index [hedged to USD]). S&P data © 2025 S&P Dow Jones Indices LLC, a division of S&P Global. All rights reserved. Frank Russell Company is the source and owner of the trademarks, service marks, and copyrights related to the Russell Indexes. MSCI data © MSCI 2025, all rights reserved. Bloomberg data provided by Bloomberg.
Notable Events in Q4
October
Strong economic data along with higher inflation readings put pressure on bonds and stocks early in the month as investors dialed back expectations for rate cuts from the Fed. The Middle East Conflict also unnerved markets as the Israel Defense Forces expanded operations into southern Lebanon. Increased tensions led to Iran launching ballistic missiles at Israel. Although bonds as measured by the Bloomberg Global Aggregate continued to fall as yields rose throughout the month, stocks posted a modest recovery mid-month as earnings reports were mostly positive. Technology stocks posted good results, but in most cases were not good enough to support stock prices that have been priced for perfection. This put more pressure on stock prices late in the month and led to negative returns for the month.
November
The election brought some sense of direction as U.S. Republicans re-gained control of the House of Representatives and now control all three parts of the U.S. federal government. This clarity may have contributed to a 5.4% return for the S&P 500 in the month, and overall positive returns for world markets. November also brought volatility to both the world and the financial markets. The first half of the month experienced ups and downs as Germany's coalition government collapsed after Chancellor Scholz fired Finance Minister Christian Lindner and over 10,000 North Korea troops joined Russian forces to fight Ukraine, though Ukraine countered by beginning to use American-made longer-range missiles.
December
The Federal Reserve cut rates by 25 basis points, reflecting confidence with inflation progress and acknowledging a cooling labor market. However, Chair Jerome Powell emphasized a slower pace of cuts in 2025 due to persistently high inflation expectations (i.e. inflation going forward). While inflation indicators, like shelter prices, are improving, trade policy uncertainties under the incoming Trump administration and rising Treasury yields driven by fiscal and economic strength pose risks. Despite this, fixed income markets offer opportunities for preservation of capital amid economic uncertainties.
Economic Indicators
Economic indicators continue to show a growing economy that gives the Fed room to slow rate cuts. To illustrate, the employment market remains resilient and stronger than expected1. Supporting this, in both the Purchasing Managers' Manufacturing Index (PMI)2 and the Institute for Supply Management (ISM)3 reports, the service sector remains on solid footing as hiring picked up following the election. Manufacturing improved from last quarter but remains in contraction as demand is soft4. However, Consumer Confidence5 shows that there is pessimism about the future, and Consumer Sentiment6 hasn’t changed much.
Overall, the economy still looks healthy, but there has been widespread concern about potential tariffs that has created a sense of negativity. In addition, it seems inflation worries are picking up as a result. The general health of the economy and low employment makes significant rate cuts less likely, while the risk of rising inflation reduces the likelihood even further. The effects of potential tariffs will be important to monitor in 2025, as higher inflation could cause a need for rate hikes and disruption in the market.
Market Impact on Major Asset Classes
Impact on Equities
The Fed signaled fewer rate cuts for 2025 during the December meeting, but the S&P 500 was still able to provide a 2.4% return in the fourth quarter. Furthermore, the continued run of the Magnificent 7 (returning over 60%) led to the second straight year of 20%+ returns, with the S&P 500 ending up 25.0%. In fact, for the past 15 years the annualized return for the index has been over 16%, compared to a long run average of about 10% per year since the 1950s. Interestingly, going back 15 years, the starting cyclically adjusted price to earnings ratio (CAPE) was 13x, and U.S. stocks were cheaper than international stocks, indicating that future returns should be strong. As it turns out, they were. U.S. small caps, measured by the Russell 2000, also performed well for the year (up 11.5%), but lagged large caps, nonetheless.
Outside of the U.S., stock returns were lower, but positive. Developed international markets, measured by MSCI EAFE, were up 4.4% for the year, as issues like Germany’s weak economy, poor export demand, rising energy costs, and a strong dollar weighed on returns.
MSCI Japan provided respectable returns, up 8.7% for the year as Japanese stocks have strong fundamentals and economic policies are normalizing.
Despite a year-end pullback, MSCI Emerging Markets also provided returns above 8% for a relatively average year. Though they continue to struggle with a weak economy, fears of potential U.S. tariffs, and a strong dollar like the rest of the world, MSCI China was a key contributor to the region with a 19.7% return in 2024.
Looking ahead, there are both risks and opportunities for global markets. Encouragingly, S&P 500 corporate EPS are forecasted to grow at 14.8% in 2025 which should provide a tailwind for U.S. stocks. While fundamentals are less promising, non-U.S. stocks are trading at a 40% discount to the U.S., which is the largest discount on record.
There are also risks. As we have mentioned before, valuations are not useful from a timing perspective, but the cyclically adjusted price to earnings ratio (CAPE) for U.S. stocks is approaching 40X, implying that returns for expensive stocks may be subdued over the intermediate term. In fact, the only time stocks were more expensive was during the dot-com bubble. While that should cause some concern, it is also true that companies today are more profitable, and the world is different than what it was in the early 2000s.
On balance, the global markets are comprised of historically expensive U.S. stocks (especially large growth), but with currently healthy fundamentals. Conversely, international stocks have weaker fundamentals, with pockets of strength, but historically inexpensive valuations. Given the risks and opportunities seem to balance in an uncertain world, diversification continues to provide a prudent path forward. As history has shown, both higher valuations eventually lead to lower returns, and lower valuations eventually lead to higher returns. It is also good to remember that some of the most dangerous words in investing are, “this time is different.”
Major World Equity Market Performance for Q4 2024
Source:
YCharts Total Returns as of 12/31/2024
Nasdaq, 2024 Review and 2025 Outlook, https://www.nasdaq.com/articles/2024-review-and-2025-outlook
Impact on Fixed Income
The bond market saw mixed performance in the fourth quarter, as concerns about growing U.S. federal deficits and fewer anticipated Fed rate cuts in 2025 put pressure on bonds. The leading bond benchmark, the Bloomberg U.S. Aggregate Bond Index, posted a moderately negative return for the quarter but managed a modest gain for the full year.
In recent weeks, both the Treasury and Municipal yield curves have returned to a more typical upward slope for the first time in several years. Since September, the Federal Reserve has reduced the Fed Funds rate by 100 basis points in response to moderating inflation. However, 10-year Treasury yields (a key benchmark for the financial markets and the broader economy) have surged by nearly 100 basis points, driven by robust economic growth, persistent inflation pressures, and concerns about a potentially widening budget deficit and higher inflation under the Trump administration. The upward sloping yield curves should encourage bond buyers to move out of cash and into longer-term debt as they will be more appropriately compensated for adding risk.
Diving into the details, shorter-duration bonds outperformed their longer-duration counterparts in both Q4 and throughout 2024, supported by ongoing Fed rate cuts. In contrast, longer-term bonds experienced declines, as concerns about fiscal policy, a strong economy, and the inflation outlook weighed on the long end of the yield curve. In both the corporate and municipal bond markets, high-yield bonds outperformed investment-grade bonds reflecting a preference for risk-taking in the face of steady economic conditions.
On the municipal front, nine states reduced their individual income tax rates on January 1, 2025: Indiana, Iowa, Louisiana, Mississippi, Missouri, Nebraska, New Mexico, North Carolina, and West Virginia. We generally view this as a credit negative as these states are reducing a regularly occurring source of revenue that is widely used to secure general obligation bonds. Internationally, both developed and emerging market bonds posted strong gains for the year emphasizing the importance of having a diversified portfolio and looking for opportunities beyond the U.S.
Major Fixed Income Index Returns for Q4 2024
Source:
YCharts Total Returns as of 12/31/2024
YCharts; Bloomberg U.S. Aggregate Total Return Index.
Tax Foundation. (2024, December 19). State tax changes taking effect January 1, 2025. https://taxfoundation.org/research/all/state/2025-state-tax-changes
Impact on Alternatives
As the Fed cuts interest rates, investors have questions about the benefits of private credit in a lower interest rate environment. Private direct lending is overwhelmingly issued as floating rate debt based on the Secured Overnight Financing Rate (SOFR), which is heavily influenced by the Fed funds rate. As the Fed cuts rates, distribution yields on private credit will fall as rates on the loans adjust, however the “spread” or premium that private credit delivers over SOFR remains consistent. The Cliffwater Direct Lending Index spread over SOFR has remained consistently in the 6.0% range, still providing attractive returns relative to other available fixed income options. By contrast, public credit markets are not only impacted by lower interest rates, but the spread over treasury bond interest rates has been falling. According to JPMorgan, the spread, or premium, over treasury bond rates for high yield bonds is currently 3.4%, below the historical average of 5.8%.
In this environment, the risk adjusted return has remained the same for private credit and fallen for public high yield, making private credit even more attractive. This can partially be explained by the shrinking size of the high yield market as private markets have taken share from public markets over the past several years. Most of the growth in private credit has come at the expense of banks, however there are cases of smaller borrowers opting to raise capital in private markets rather than issuing non-investment grade bonds. Cliffwater forecasts private credit to yield 9.3% in 2025, down from 10.5% in 2024. This compares favorably to the SPDR high yield bond ETF of yield of 7.74% for a similar amount of credit risk and lower equity correlation than high yield.
Performance of Alternative Assets
Sources:
Cambridge Associates as of 12/31/2024
TIAA-CREF Center for Farmland Research, Standard & Poor’s, Federal Reserve, MSCI,
Commodity Research Bureau, Consumer Price Index, NCREIF Farmland (Inception date 4Q 1990)
Looking ahead
Stock and bond markets had large swings through the fourth quarter. Early reaction to the election provided optimism to equity markets that lower taxes and regulation would be a boon to corporate profits, driving stocks higher. Bond investors, concerned over potential increases to deficits and inflation, pushed yields higher and eventually tempered stock market expectations. Political beliefs can generate emotional reactions leading to investment decisions that harm long-term returns. History shows that total time in the market is the driver to better returns, not the President’s political party. An investment of $1,000 in 1953 would have an ending value of $31,000 if invested only during Republican presidencies, $60,000 if invested only during Democratic presidencies or almost $1.9 million if held the entire 70 years7. It is helpful to keep in mind that, despite differences in beliefs, both parties share the intent of supporting a strong economy and will adjust policies to achieve this goal.
It is also important to remember that TMG portfolios are diversified across asset classes and regions, designed to reduce volatility, and optimize returns over the long term. When appropriate for clients with longer time horizons, alternative investments offer greater diversification and the chance to enhance returns. For clients that prefer a more tactical approach, we offer more active management that seeks to take advantage of shorter-term trends within a diversified strategic asset allocation. Most importantly, TMG has and will continue to deploy its sophisticated technology and trading systems to add value during periods of market volatility by conducting tax-loss harvesting, strategic rebalancing, and accelerating Roth conversions, when appropriate. We appreciate your trust and confidence in managing your investments. Our team remains committed to monitoring the markets and making informed decisions to ensure your portfolios are well-positioned for future opportunities.
1 2025 U.S. Economic Events & Analysis – Employment Situation, Econoday, 1/10/2025.
2 2025 U.S. Economic Events & Analysis – PMI Composite Final, Econoday, 1/6/2025.
3 2025 U.S. Economic Events & Analysis – ISM Services Index, Econoday, 1/7/2025.
4 2025 U.S. Economic Events & Analysis – PMI Manufacturing Final, Econoday, 1/2/2025; 2025 U.S. Economic Events & Analysis – ISM Manufacturing Index, Econoday, 1/3/2025.
5 2024 U.S. Economic Events & Analysis – Consumer Confidence, Econoday, 12/23/2024.
6 2025 U.S. Economic Events & Analysis – Consumer Sentiment, Econoday, 1/10/2025.
7 BlackRock Student of the Market 8/31/2024, holding period 1/1/1953 – 8/31/2024.
Need more help?
Contact The Mather Group, your advisor, health insurance professional, or your state’s health insurance assistance program (SHIP) for additional information. SHIP is a national program that offers one-on-one Medicare counseling and assistance to individuals and their families.
.avif)